
In The Future of BIM, I specifically mentioned an application called Dynamo for Revit. Within the Revit ecosystem, Dynamo is not only the tool of choice for computational designers, but an alternative to computer programming.
Simply put, Dynamo for Revit is a visual scripting tool and gives its users the capability of leveraging the Revit API to automate a chain of commands that might otherwise be extremely time consuming. These scripts can aid in anything from automating repetitive tasks, managing data, or generating complex geometry in Revit. If you’re looking to break into the field of computational design, it actually requires in-depth understanding of all of the above.
The reason Dynamo for Revit is referenced as a “visual scripting” tool is because it gives users almost all of the power of tapping into the Revit API with absolutely zero software development experience. Keep in mind that a basic understanding coding in Python can give users the ability to break through some of the limitations of Dynamo (yes, there are limitations).
Dynamo Graphs Explained
A script in Dynamo is saved as a file with the extension of “dyn” and is often referred to as a graph. It looks similar to a flow chart, and rightfully so, as it is comprised of a series of inputs, outputs, and functions.

In Dynamo, a node does all of the work. The image above is the addition node, which serves to add two values together. Keynotes #1 and #2 are the inputs labeled “x” and “y” while the output is identified with keynote #3.

In the example above, you’ll see that I’ve connected the output of two Number nodes to “x” and “y”. The output of the Addition node is connected to a Watch node which has the sole purpose of visually displaying an output.

You may have noticed that the Watch node has an output as well. In the example above, I’ve taken the output of the Watch node and connected it to a Multiplication (*) node to multiple it by 100.
Once you have a graph comprised of nodes wired together as displayed in the example above, you may start to understand why this is called visual scripting. If you were to write out an equivalent script in a more conventional software development language such as C#, it would look something like:
[code language=”csharp”] int x = 1; int y = 1; int sum = x + y; Console.WriteLine(sum.ToString()); int z = 100; int result = sum * z; Console.WriteLine(result.ToString()); [/code]Example: Automating the Repetitive Tasks

One example of how a Revit user can leverage Dynamo for Revit automation is the creation of sheets. If you’re currently creating sheets in Revit individually, stop what you’re doing because Dynamo can create dozens of sheets for you in seconds.
Dynamo can read Excel spreadsheets out of the box and map sheet numbers paired with sheet names into Sheets within a Revit project. A quick search on the Dynamo forum returns several discussions around this task.
Example: Data Wrangling
Historically, wrangling the data within Revit models manually has been a daunting task. The interface of editing schedules has left much to be desired even with the application’s latest 2019 release. While there are several third-party tools out there in the BIM ecosystem to aid in this type of work, these often involve licensing fees.
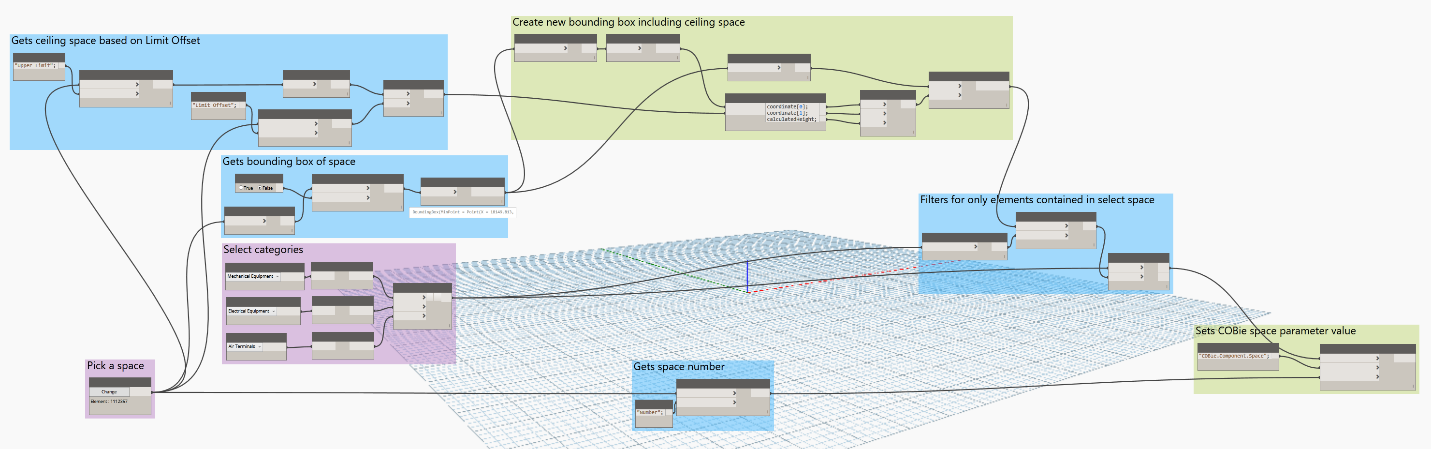
One of the most useful graphs that I’ve built in the realm of data manipulation is to help relieve some of the grunt work associated with COBie compliance. This graph will take a room number from the Number parameter of a Room element and push it into the COBie.Component.Space parameter of an element that is either within the Room or in the ceiling space above the Room. The graph takes the bounding box of the room and expands essentially “stretches” it to include the ceiling space. You can access further information on this graph including the workflow and details of the function of each node or download it free here.
Conclusion
With a basic understanding of what Dynamo for Revit can do, I challenge you to keep an eye out for opportunities for automation. Even if you have a tool that can push parameters values from one to another, try to accomplish it on your own in Dynamo. Or if you find yourself pushing the same button twenty times in a row, consider if that repetitive task can be accomplished with Dynamo. Dynamo for Revit makes automation available to users, whether or not you know how to code.
Resources
If you’re just stating out on your journey to learn Dynamo for Revit, one of the best free resources is the Dynamo Primer. This is the de facto reference guide which covers everything you’ll need to know to get started.
If you already understand how to use Dynamo for Revit but have run into a roadblock with a graph you’re developing, I highly recommend asking for help in the DynamoBIM forums. These forums are highly active and have passionate advocates who are willing to help out those in need.